DyRes system project team has been performed several activities during the previous period.
Observed meteorological daily data from 5 meteorological stations for the period of 67 years (1950-2016) has been analyzed. Based on the observed climatic data (precipitation and temperature), synthetic precipitation and temperature for a period of 1000 years have been generated by using the KNN Weather Generator program developed by S. Mandal et al. (2016).
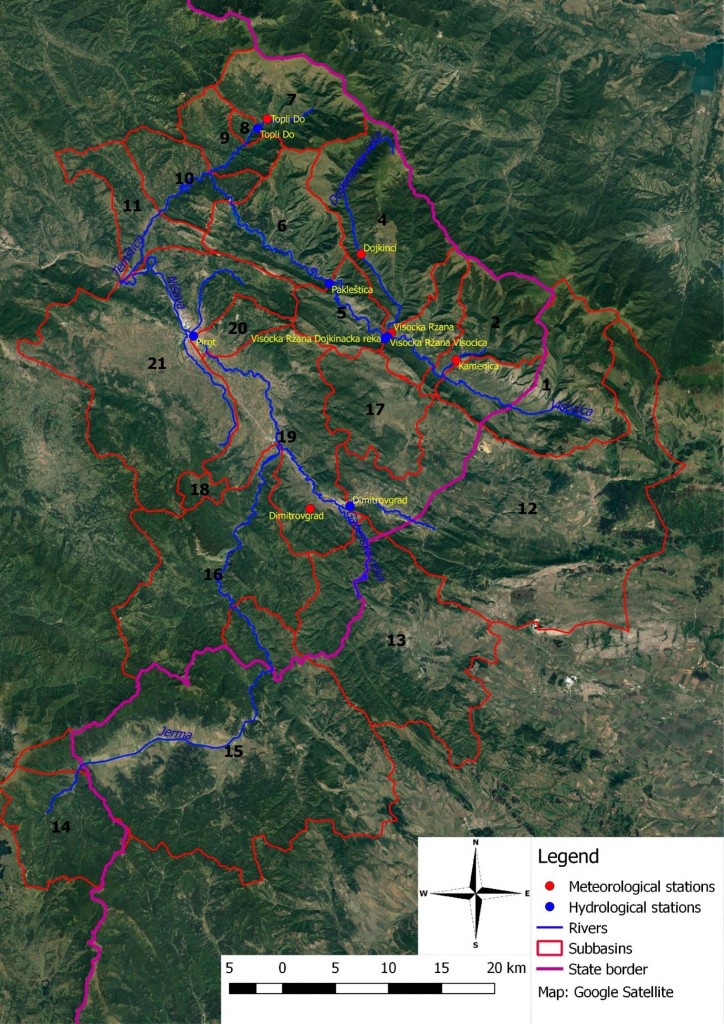
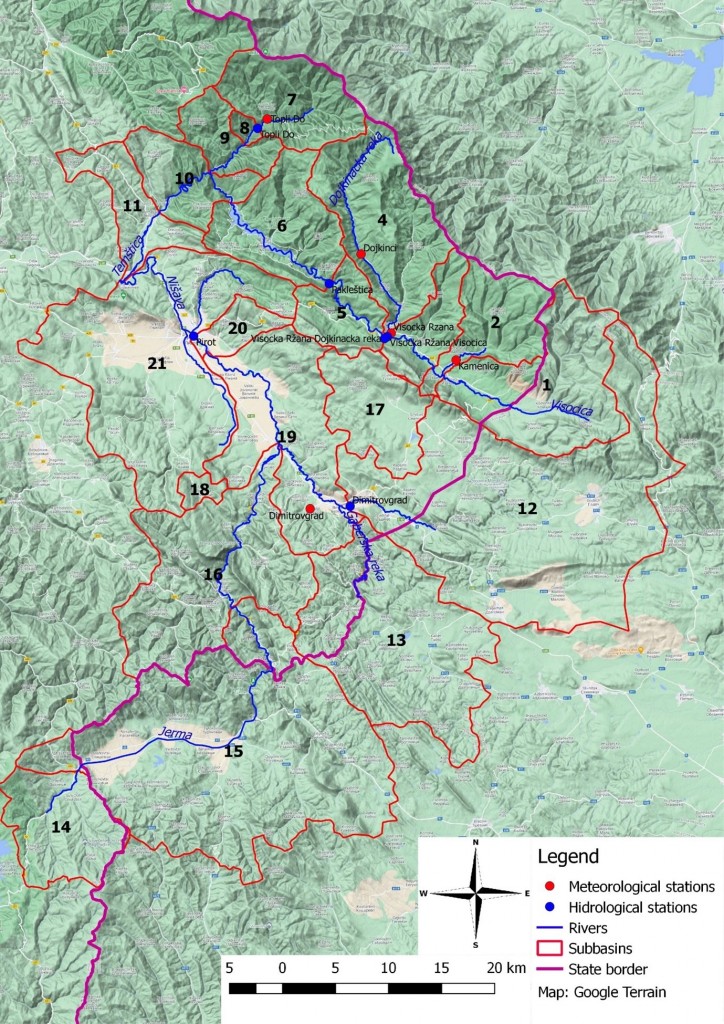
A hydrological model of the Pirot water System with 5 meteorological stations has been developed in PRMS (Precipitation-Runoff Modeling System – Regan et al., 2017; Markstrom et al., 2015). The hydrological model of the Pirot water system includes 21 subbasins within the upper Nišava river basin. The observed flow, precipitation and temperature have been used for model calibration. The hydrological model parameters have been calibrated using the USGS LUCA automatic calibration software (USGS LUCA Software). Then, synthetic precipitation and temperature series for the period of 1000 years were utilised as an input to the hydrological model.
Alongside, the inputs for finite element stability model of the Zavoj dam has been have been prepared. This activity includes 3D terrain model as well as dam elements.
Measured and modeled flow values

Figure 1. Delineation of subbasins in a hydrological model on a Google Satellite map

Figure 2. Delineation of subbasins in a hydrological model on a Google Terrain map

Figure 3. Measured (blue line) and modeled (orange line) flow values using PRMS model on HS Visočka Ržana – Dojkinačka reka (period: 28.05.2005.-23.10.2015.)

Figure 4. Measured (blue line) and modeled (orange line) flow values using PRMS model on HS Topli Do (period: 15.03.2000.-01.04.2012.)

Figure 5. Measured (blue line) and modeled (orange line) flow values using PRMS model on HS Dimitrovgrad (period: 31.01.1993.-28.05.2005.)

Figure 6. Measured (blue line) and modeled (orange line) flow values using PRMS model on HS Pakleštica (period: 01.09.2002.-18.08.2016.)

Figure 7. Measured (blue line) and modeled (orange line) flow values using PRMS model on HS Pirot (period: 11.06.1968.-24.11.1990.)

Figure 8. Developed 3D terrain model of the Zavoj dam

Figure 9. 3D model of the Zavoj dam elements
Literature
- Mandal, P. A. Breach, A. Gaur and S. P. Simonovic (2016). Tools for Downscaling Climate Variables: A Technical Manual. Water Resources Research Report no. 097, Facility for Intelligent Decision Support, Department of Civil and Environmental Engineering, London, Ontario, Canada, 95 pages. ISBN: (print) 978-0-7714-3135-7; (online) 978-0-7714-3136-4.
- Markstrom, S.L., Regan, R.S., Hay, L.E., Viger, R.J., Webb, R.M.T., Payn, R.A., and LaFontaine, J.H., 2015, PRMS-IV, the precipitation-runoff modeling system, version 4: U.S. Geological Survey Techniques and Methods, book 6, chap. B7, 158 p. https://www.usgs.gov/software/precipitation-runoff-modeling-system-prms
- Regan, R.S., Markstrom, S.L., LaFontaine, J.H., 2017 PRMS version 4.0.3: Precipitation-Runoff Modeling System (PRMS): U.S. Geological Survey Software Release, May 5, 2017.
- USGS LUCA Software (Let us calibrate), https://wwwbrr.cr.usgs.gov/projects/SW_MoWS/LUCA.html